Inroducing GreenForecast.au
What’s the greenest time of the day or week to use electricity?
Sadly, the answer is complicated: it depends on your state, the season, the day of the week, the weather and even how much rain there was in the mountains last year.
It makes a big difference: the amount of carbon used to charge your EV at the “greenest time of the week” vs the “least green” is often double but potentially 10x as high.
Currently, there’s no simple way to track renewable energy output in real-time, let alone how this might change over the next day or week.
That’s why I built greenforecast.au, an AI-powered 7-day outlook for renewable energy and power-prices in Australia’s National Electricity Market. Like a weather forecast, but for “how green will the grid be tomorrow?”.
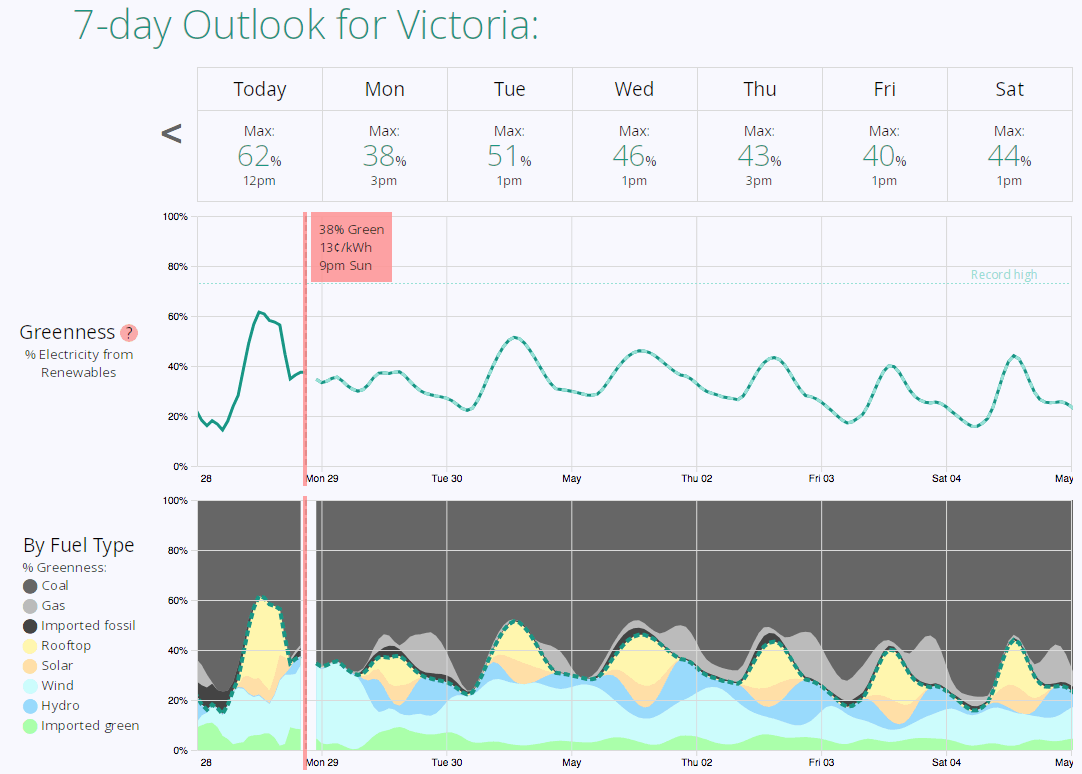
It uses “AI” (ie. an ensemble of modern data science and machine learning techniques) to predict “Greenness” for the next week for all 5 NEM regions. Updated every 2 hours, the forecast can help you find the best time to schedule discretionary electricity loads, potentially cutting the carbon footprint of that electricity by half.
At this point, many ask “Does shifting my electricity usage from one part of the week to another actually reduce my carbon footprint?”. The short answer is “yes”, but the complete rationale involves a surprising level of complexity. See here for the technical details.
You view the website for no cost, no account required. You can also check out the source on github too.
If you find it useful, I’d love to hear about it! info[AT]greenforecast.au or @GreenForecastAu on twitter.